5 Basic science and measurement
Biology is a science, but what exactly is science? What does the study of biology share with other scientific disciplines? We can define science (from the Latin scientia, meaning “knowledge”) as knowledge that covers general truths or the operation of general laws, especially when acquired and tested by the scientific method. It becomes clear from this definition that applying scientific method plays a major role in science. The scientific method is a method of research with defined steps that include experiments and careful observation. One of the most important aspects of the scientific method is the testing of hypotheses using repeatable experiments. A hypothesis is a suggested explanation for an event, which we can test.
However, consider archaeology—even though one cannot perform repeatable experiments, hypotheses may still be supported. For instance, archaeologists can hypothesise that an ancient culture existed based on finding a piece of pottery. They could make further hypotheses about various characteristics of this culture, which could be correct or false through continued support or contradictions from other findings. A hypothesis may become a verified theory. A theory is a tested and confirmed explanation for observations or phenomena. Therefore, we may be better off defining science as fields of study that attempt to comprehend the nature of the universe. One thing is common to all forms of science: an ultimate goal ‘to know’. Curiosity and inquiry are the driving forces for the development of science. Scientists seek to understand the world and the way it operates. To do this, they use two methods of logical thinking: inductive reasoning and deductive reasoning.
Inductive reasoning is a logical process where related observations are used to draw a general conclusion. This method is often used in descriptive science. For instance, a veterinarian might observe and record various symptoms in animals. These observations can be qualitative (descriptions) or quantitative (numbers), and can be supplemented with images, videos, or drawings. By analysing data from observations, veterinarians can make general conclusions based on evidence.
 For example
When studying a group of dogs with similar symptoms, such as coughing and lethargy, by carefully observing and recording the symptoms and any related factors, such as diet or environment, you may notice that all affected dogs have been exposed to a specific type of plant. Using inductive reasoning, you could hypothesise that this plant might be causing the symptoms. Further testing and observation would then be needed to confirm this hypothesis.
Deductive reasoning or deduction is the type of logic used in hypothesis-based science. It is a form of logical thinking that uses a general principle or law to predict specific results. From those general principles, a scientist can predict the specific results that would be valid as long as the general principles are valid. Studies in climate change can illustrate this type of reasoning.
- Scientists may predict that if the climate becomes warmer in a particular region, then the distribution of plants and animals should change.
- If we consider the general principle that ‘all mammals have a four-chambered heart.’ Using deductive reasoning, we can predict that a newly discovered mammal species will also have a four-chambered heart, based on the general principle about mammalian heart structure. In practice, if you observe a new animal and confirm it is a mammal, you can confidently predict its heart structure based on this general principle.
- A veterinarian often uses deductive reasoning to predict that a treatment effective in one species will also be effective in a related species if those species, for example, share physiological similarities. This approach is particularly useful when empirical data (or research studies) is lacking, allowing you to make informed decisions. This type of reasoning helps veterinarians make informed predictions and diagnoses based on established scientific principles.
Both types of logical thinking are related to the two main pathways of scientific study: descriptive science and hypothesis-based science. Descriptive (or discovery) science, which is usually inductive, aims to observe, explore, and discover, while hypothesis-based science, which is usually deductive, begins with a specific question or problem and a potential answer or solution that one can test. The boundary between these two forms of study is often blurred, and most scientific endeavours combine both approaches. The fuzzy boundary becomes apparent when thinking about how easily observation can lead to specific questions.
For example
A gentleman in the 1940s observed that the burr seeds that stuck to his clothes and fur from his dog had a tiny hook structure. On closer inspection, he discovered that the burrs’ gripping device was more reliable than a zipper. He eventually experimented to find the best material that acted similarly, and produced the hook-and-loop fastener popularly known today as Velcro.
Researchers from almost all fields of study can apply the scientific method as a logical, rational problem-solving method. Veterinarians study the health and behaviour of animals by posing questions and seeking science-based responses. The scientific process typically starts with an observation (often a problem to solve) that leads to a question. Let’s think about a simple problem that starts with an observation and apply the scientific method to solve the problem.
 Case study: Developing and testing a hypothesis
One Monday morning, you arrive at the clinic and quickly discover that an 8-year-old Boxer in your care is lethargic and not eating. This is an observation that also describes a problem: the dog is lethargic and not eating. This poses the question: “Why is the dog lethargic and not eating?”
Recall that a hypothesis is a suggested explanation that one can test. To solve a problem, we can propose several hypotheses. For example, one hypothesis might be, “The dog is lethargic and not eating because it has an infection.” However, there could be other responses to the question, and therefore, we may propose other hypotheses. A second hypothesis might be, “the dog is lethargic and not eating because it has ingested a toxic substance.” Once we have selected a hypothesis, we can make a prediction. A prediction is similar to a hypothesis, but it typically has the format “if . . . then . . . ”, for example, the prediction for the first hypothesis might be, “if the dog is given antibiotics, then it will become more active and start eating.”
A valid hypothesis must be testable. It should also be falsifiable, meaning that experimental results can disprove it. Importantly, science does not claim to ‘prove’ anything because scientific understandings are always subject to modification with further information. This step—openness to disproving ideas—is what distinguishes sciences from non-sciences. The presence of the supernatural, for instance, is neither testable nor falsifiable. To test a hypothesis, a researcher will conduct one or more experiments designed to eliminate one or more of the hypotheses. Each experiment will have one or more variables and one or more controls. A variable is any part of the experiment that can vary or change during the experiment. The control group contains every feature of the experimental group except it is not given the manipulation that the researcher hypothesises. Therefore, if the results differ from the control group, the difference must be due to the hypothesised manipulation, rather than some outside factor.
To test the first hypothesis, we might administer antibiotics to the dog and monitor its response. If the dog becomes more active and starts eating, the hypothesis is supported. If the dog does not improve, we reject this hypothesis. To test the second hypothesis, we could check for signs of poisoning, such as vomiting or unusual behaviour, and possibly conduct a toxicology screen. If the tests indicate the presence of a toxic substance, the hypothesis is supported. If not, the student should reject this hypothesis. We test each hypothesis by carrying out appropriate experiments. Be aware that rejecting one hypothesis does not determine whether we can accept the other hypotheses. It simply eliminates one hypothesis that is not valid. Using the scientific method, we reject the hypotheses that are inconsistent with experimental data.

 Reflective question
What are the variables and controls in the examples above?
In recent years, computer algorithms and statistical analyses of data in database have resulted in a new field of ‘data analytics’ for evaluation. The search for knowledge involves successive approximations to objective reality. Modelling natural systems enables us to make predictions to mitigate or control potential problems. In veterinary science, the aim is to enhance life, manage production, and control or cure diseases. Examples include improving individual fitness and well-being, increasing meat, fleece, or milk production, boosting fecundity (more offspring), and breeding faster horses.
An axiom is an agreed starting point in science and mathematics, serving as a fundamental truth that doesn’t require proof. In measurement, axioms provide the basic definitions and language we use to understand and quantify the world around us. We need to know what we started with because axioms form the foundation of any knowledge or teaching. They are the basic building blocks from which we develop more complex theories and measurements. For example, the definition of a metre as a unit of length is an axiom in the metric system. However, some axioms might be wrong and may need reconsideration. As our understanding evolves, we sometimes find that what we once accepted as true needs to be revised. This is why you will see things ‘change’ that you learnt at school and university. Scientific progress often involves re-evaluating and updating our axioms to reflect new discoveries and insights. But we have to start somewhere! Axioms provide a necessary foundation, even if they are not perfect. They allow us to build a coherent framework for measurement and understanding, which can be refined and improved over time.
Consider the axiom that ‘all healthy dogs have a normal body temperature range of 38.3°C to 39.2°C’. This axiom serves as a starting point when assessing the health of a dog. If a dogs temperature falls outside this range, it may indicate a health issue that requires further investigation.
How measurement works
Measurement has historically involved comparing an object to a known reference. For length, these references were often parts of the human body. For example, a cubit was the distance from the elbow to the fingertips. Since this varied between individuals, the ‘King’s cubit’ was used, which changed with each new king. Obviously, carrying a king around for measurements wasn’t practical! Another example is the foot, originally based on the human foot, which we still use today. To achieve more consistency, measurements began to rely on artefacts—objects made for the purpose of standardisation. These artefacts are called standards because they have minimal variation. A good example is a set of balance scales. To measure an unknown weight, you place it on one side of the scale and standard weights on the other. You add or remove weights until the scale balances. At this point, the gravitational force on the unknown object equals the force on the standard weights. This comparison allows us to determine the weight of the object accurately. The System International (SI) measurement system is recognised by law in 61 signatory countries, including Australia, and is centrally controlled from the International Bureau of Weights and Measures (BIPM) (Figure 2.1). The metre was defined based on the Earth’s quadrant, which is the distance from the equator to the North Pole. Specifically, one metre was set to be one ten-millionth of this distance.
“For the first time, a complete set of definitions is available that does not make reference to any artefact standards, material properties or measurement descriptions. These changes enable the realization of all units with an accuracy that is ultimately limited only by the quantum structure of nature and our technical abilities but not by the definitions themselves.” BIPM SI Brochure, Ed 9.
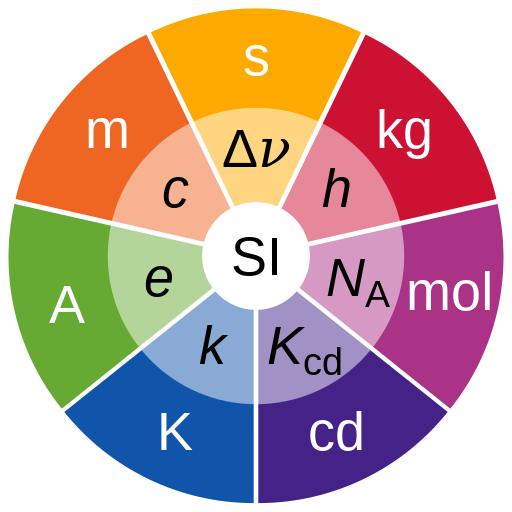
There are seven basic measures used in defining all parameters in the universe (Table 2.1). Listed with their base (principal definition) units and unit abbreviation, these are: time (second, s); mass (kilogram, kg); electric current (ampere, A); thermodynamic temperature (kelvin, K); length (metre, m); amount of substance (mole, mol) and luminous intensity (candela, cd). All other SI units and constants that we use in measurement can be defined exactly from these measures or in terms of them.
Table 2.1 Defining basic measures
| Measure | Definition |
| Second | Defined as the duration of 9,192,631,770 periods of radiation from the transition between the two hyperfine levels of the unperturbed ground state of the caesium-133 atom |
| Kilogram | Define by the fixed numerical value of the Planck constant (h) as 6.62607015 × 10⁻³⁴ J·s, with the metre and second defined in terms of c and ΔνCs |
| Ampere | Defined by the fixed numerical value of the elementary charge (e) as 1.602176634 × 10⁻¹⁹ C, with the second defined in terms of ΔνCs |
| Kelvin | Defined by the fixed numerical value of the Boltzmann constant (k) as 1.380649 × 10⁻²³ J/K, with the kilogram, metre, and second defined in terms of h, c, and ΔνCs |
| Mole | Defined by Avogadro’s constant (Nₐ) as 6.02214076 × 10²³ mol⁻¹ |
| Candela | Defined by the fixed numerical value of the luminous efficacy of monochromatic radiation of frequency 540 × 10¹² Hz (Kcd) as 683 lm/W, with the kilogram, metre, and second defined in terms of h, c, and ΔνCs |
In the SI units system:
- Unperturbed ground state hyperfine transition frequency of caesium-133 atom (ΔνCs): 9,192,631,770 Hz
- Speed of light in vacuum (c): 299,792,458 m/s
- Planck constant (h): 6.62607015 × 10⁻³⁴ J·s
- Elementary charge (e): 1.602176634 × 10⁻¹⁹ C
- Boltzmann constant (k): 1.380649 × 10⁻²³ J/K
- Avogadro constant (Nₐ): 6.02214076 × 10²³ mol⁻¹
- Luminous efficacy of monochromatic radiation of frequency 540 × 10¹² Hz (Kcd): 683 lm/W
Originally, variations in standards of 1 ppm were considered acceptable but there are two considerations. First, the 1 ppm might be acceptable as an absolute variation, but not a rate of change: 1 ppm per time period is unacceptable, (hence the imperial yard’s redefinition.) The second consideration is that technology is now sufficiently developed to require accuracies at least 100 times better (1×10⁻⁸). Standards must therefore be more accurate still. The standard therefore had to be redefined, based on a fundamental constant in the same way as the second and the metre. It was based on the Planck constant, using new abilities to measure with great accuracy.
 Dive deeper
Watch TED-Ed. (2012, September 12). How big is a mole? (Not the animal, the other one.) – Daniel Dulek [YouTube, 4:32mins]
Standardisation of measurement
When measuring something, we compare it to a standard. For example, to measure the length of an object, place a ruler with gradations next to it. Align the zero on the ruler with one end of the object and read the marking closest to the other end. Modern rulers typically have millimetre (mm) markings. If the object’s length falls between two marks, estimate the closest one. For instance, if the length is approximately 176 mm, you might estimate it as 176.4 mm if it appears just under halfway between two marks. This measurement is an approximation. The accuracy of this approximation depends on the precision of the ruler. If the ruler’s markings are accurate to ±1 mm, then estimating to 0.1 mm is pointless. Measurement tools like rulers, volumetric flasks, or scales usually have their accuracy indicated on them. If not, assume an accuracy of ±1 graduation unit. For a ruler marked in mm, report measurements as accurate to ±1 mm unless otherwise specified.
Calibration of measuring tools is essential. It involves validating the tool against a more accurate standard. For example, wooden rulers are stable unless wet, while metal rulers expand and contract with temperature changes. Laboratory glassware, like measuring cylinders or pipettes, must be used at room temperature (20°C) for accurate measurements. Most lab glassware has a calibration accuracy of ±5%, with the best achieving ±1%.
Calibration ensures precise and reliable measurements. When we measure a known quantity (a standard), we can identify any inaccuracy in the device. By correcting for these systematic errors, we obtain highly accurate results. Calibration often involves adjusting the device to interpret the correct value for a standard. In laboratories, calibration is essential for ensuring the validity of results. Some devices require frequent calibration.
Re-calibration is required for precision devices whose systematic error changes over time. Overall, calibration is crucial for maintaining the accuracy and consistency of measurements in scientific and industrial applications.
For example
A common example of a blood test that requires a calibrated device and a daily standard is the measurement of blood glucose levels using a glucometer. Glucometers are devices used to measure the concentration of glucose in the blood, which is crucial for managing diabetes. To ensure accurate readings, glucometers must be calibrated regularly. Calibration involves adjusting the device to match a known standard, ensuring that the readings are accurate and reliable. Each day, a control solution with a known glucose concentration is used to check the accuracy of the glucometer. The control solution acts as a standard, providing a reference point. By running the control solution through the glucometer, you can verify that the device is providing correct readings. If the reading matches the known value of the control solution, it confirms that the device is properly calibrated. If not, recalibration or maintenance may be needed. This process ensures that the glucometer provides accurate blood glucose readings, which is essential for effective diabetes management. Regular calibration and use of standards help maintain the reliability of the device, ensuring we can trust the measurements for making informed decisions about treatment and care.
Accuracy and precision
Accuracy refers to how close a measurement is to the true value. It can be expressed as absolute or relative accuracy and applies to both measurements and calculations based on them. When combining measurements, the accuracy must be treated consistently, and it decreases as more measurements are multiplied. It’s important not to express results with greater accuracy than the original measurements, as this can be misleading. External factors like humidity and temperature can affect accuracy.
Precision is the ability to reproduce the same measurement consistently. Variations in an imprecise instrument are known as random errors. Poor precision means that each measurement’s accuracy must be externally validated. Precision issues often arise from drift, especially in electrical devices, and can be influenced by external conditions, such as wind affecting weigh scales.
Therefore, accuracy is the closeness to the true value, while precision is about consistency in measurements. Both can be affected by external factors and require careful consideration in scientific measurements.
Some measuring devices have absolute accuracy, meaning their accuracy range remains constant regardless of the measurement size. For example, a ruler with an accuracy of ±0.1 mm maintains this accuracy whether measuring 10 mm or 1000 mm, as the markings are consistently placed. In contrast, a measuring tape offers relative accuracy, where the potential error increases proportionally with the distance measured due to stretching. Most errors are proportional to the measurement, but absolute accuracy can also be significant. For instance, the absolute accuracy of a ruler might seem consistent, but small errors between graduations can accumulate over longer distances. Additionally, most devices have a base error, though proportional error is usually more critical. Relative accuracy decreases with smaller measurements due to reading difficulties.
Considerations and errors in measurement
Self-reference in measurement occurs when a measurement system or tool refers to itself in its operation or definition. This can lead to significant issues, particularly in ensuring accuracy and consistency. One example is the use of a ruler to measure its own length. If the ruler is not perfectly accurate, any measurement it makes of itself will inherit and possibly amplify its inaccuracies. This creates a feedback loop where errors compound, leading to unreliable results. In scientific experiments, self-referential measurements can introduce biases. For instance, if a thermometer is calibrated using a reference temperature that it itself measures, any error in the thermometer’s reading will affect the calibration, leading to systematic errors in all subsequent measurements. These flaws highlight the importance of using independent and well-calibrated reference standards in measurement. Without such standards, self-referential systems can produce misleading data, undermining the reliability of scientific findings. Understanding these concepts is important as it emphasises the need for rigorous calibration and validation of measurement tools to ensure accurate and trustworthy data in scientific research. For example, if you are using a digital scale to weigh animals in a veterinary clinic, the scale is not properly calibrated and you use it to check its own accuracy, any error in the scale reading will affect the calibration process. For instance, if the scale consistently shows a weight that is 0.5kg too high, and you use this incorrect reading to calibrate the scale, all subsequent measurements will inherit this error. This creates a feedback loop where inaccuracies compound, leading to unreliable weight measurements for the animals.
Errors in measurement can be systematic or random. Systematic errors occur when a measurement is consistently wrong by the same amount or proportion each time. These errors produce inaccuracy but can be accounted for by adjusting the measurements accordingly. For example, if a scale consistently overestimates weight by 2 grams, you can subtract 2 grams from each measurement to correct it.
Random errors vary unpredictably with each measurement, leading to imprecision. For instance, weighing an item multiple times might yield slightly different results each time, such as 346 g, 345 g, and 348 g. This variability is due to random error, also known as imprecision. Measuring multiple times and calculating the mean can suggest a precise result, but it doesn’t guarantee accuracy.
Reading a volumetric device requires specialised knowledge, and even reading a ruler can be tricky. For instance, ruler markings have a minimum width, so you need to know whether to read from the centre, left edge, or right edge. Arbitrary reading adds inaccuracy. Rulers with a rectangular cross-section have graduations that are distant from the object being measured, causing parallax error. This error occurs when the scale and the object are not in the same plane, leading to under- or over-reading. To reduce parallax error, use wedge-shaped rulers with markings on the narrow side or clear plastic rulers with gradations on the underside.
Parallax error also affects measuring cylinders if our eyes are not level with the measurement point. The measurement line runs around the cylinder to help align the front and back, ensuring a level reading. The meniscus, the curved surface of a liquid, varies with different fluids. For water, read from the flat part of the meniscus; for mercury, read from the upper curve. The ISO 4787:2010 standard specifies that the meniscus should be read at eye level, with the upper edge of the graduation line tangential to the lowest point of the meniscus. Proper lighting helps make the meniscus distinct. These considerations ensure we record accurate volume measurements.
Knowledge check
